See how your digital experience stacks up.
Download the 2024 Retail Digital Experience Benchmark Report for the metrics that really matter.


Ecommerce conversion rates dropped by -5.8% last year. We explored what might be behind this decline in a recent article. But enough about the problem; let’s talk solutions.
We’ve seen the three eCommerce conversion rate optimization (CRO) strategies featured in this article work wonders for the conversion rates of leading retailers (we’ve provided links to their stories throughout).
Combined with the general tips for conversion rate optimization and guide to becoming a strategic CRO specialist we provide elsewhere on our website, these CRO strategies will help you grow from strength to strength in 2024.
And that’s in spite of the troubling signs of an eCommerce decline found in our 2024 Retail Digital Experience Benchmark report.
For this year’s report, we’ve analyzed 25 billion site visits from 1,673 retail sites, operating across 10 retail sub-industries and in 23 countries to bring you a truly comprehensive picture of the state of digital customer experiences in retail last year.
The strategies in this article are all informed by that analysis. You can find more insights and strategies for digital customer experience success inside.
See how your digital experience stacks up.
Get my free copy
Download the 2024 Retail Digital Experience Benchmark Report for the metrics that really matter.
The first step to ensuring eCommerce conversion rate optimization is to minimize bounces. Bounce rates rose in retail last year, increasing from 45.8% in 2022 to 46.4% in 2023.
Home Goods & Furnishings had the lowest (‘only’ 43.7%), while Appliances & Household Goods had the dubious honor of achieving the highest with a bounce rate of 61.4%. All sub verticals, however, saw an increase.
So what can retailers do to stop site visitors bouncing? Priority number one should be to scour their customer journeys to find and eliminate friction.
User frustration impacted two in five (40%) retail sessions last year, and frustration factors are doing serious damage to eCommerce conversion rates.
For example, issues with site performance not only damage the on-site experience, but also a site’s search ranking.
This is because sites with slow page loads fall short of some of Google’s most important Core Web Vitals (CWVs) standards. We go into detail about each of these standards—and how they impact a site’s ability to convert—in our report:
As a result, these websites had a +3.9% higher bounce rate than fast loading sites.

Delivering friction-free user journeys is about identifying precisely where in your journeys users are getting frustrated (which isn’t always easy), and understanding exactly what’s causing users to feel frustrated (which isn’t always obvious).
To understand both the ‘where’ and ‘why’ of user frustration, you need a digital experience analytics (DXA) solution. A solution like ours: Contentsquare’s Digital Analytics Cloud.
Our platform will not only enable you to track and measure every stage of the customer journey, leveraging AI to alert you to the presence of points of friction (and delight), but also empower you to dig behind the metrics and understand why visitors are behaving as they are.
Using Contentsquare’s Customer Journey Analysis tool, the digital team at shoe retailer Clarks noticed a significant drop off in visitors adding products to baskets via its product details page. To investigate further, they applied Zone-based Heatmaps to the product detail pages.
Almost immediately, they noticed that more visitors were interacting with Size and Add to Cart buttons than with the Width selector feature. Given that selecting width is a required step to take to get to checkout, this was a big problem.
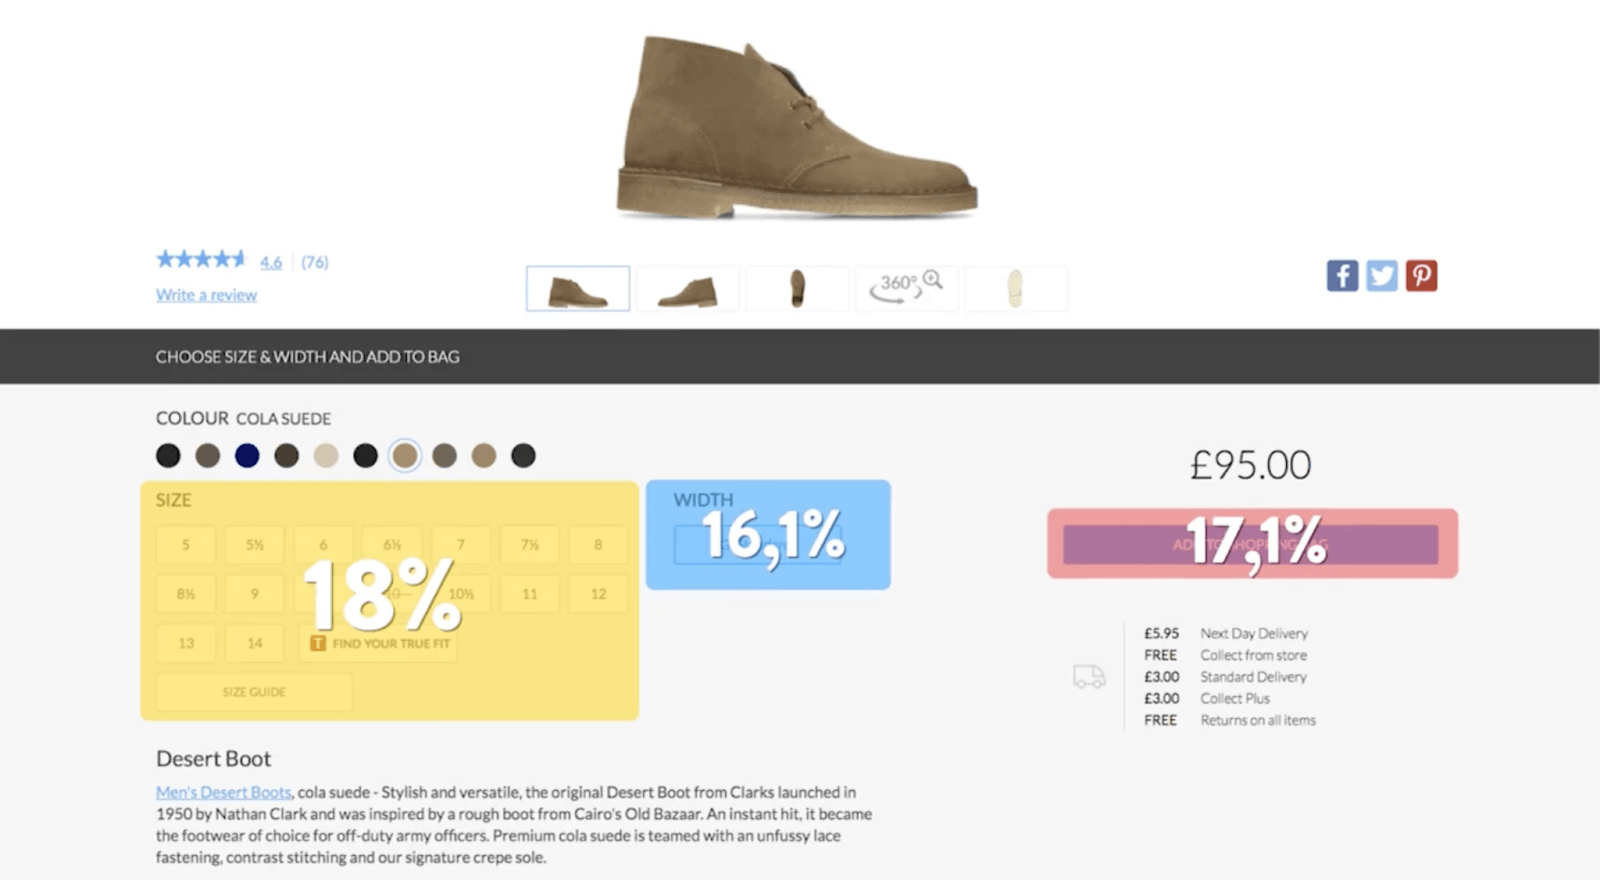
Based on this insight, Clarks decided to try pre-selecting widths for items when only one width-fit was available, thereby removing unnecessary friction from the shopping journey.
This increased the Add to Cart rate, driving $1.1million in annual revenue.
Any technical or user experience (UX) related issues on your checkout page need to be detected and dealt with fast. After all, you don’t want to fall at the last hurdle—and a surprising number of businesses do exactly that.
Reducing friction at the checkout page can pay big dividends when it comes to conversion rates. Just ask the digital team at luxury department store Harrods. They used Contentsquare to uncover and resolve numerous issues affecting their site’s check-out process.
As a result of these fixes, Harrods saw an 8% decline in cart abandonment and an increase in conversions.
Securing conversions isn’t just about removing friction from the path of site users. It’s also about persuading them to move further down that path.
Retailers need to ensure their customer journeys aren’t just friction-free, but also highly engaging. Thanks to our 2024 Retail Benchmark report, you can now put a number on just how valuable each user interaction is. The key is consumption, an important measure of engagement.
We measure consumption on sites by analyzing the amount consumed by a visitor during a session, including page views and time spent per session. We found that, although 51.7% of sites saw session consumption fall last year, there were bright spots, too. Appliances & Household Goods and Consumer Electronics saw double-digit increases in consumption, by +14.1% and +11%, respectively.
See how your digital experience stacks up.
Get my free copy
Download the 2024 Retail Digital Experience Benchmark Report for the metrics that really matter.
To make the most of every visit, digital leaders have to layer in relevant content based on segments, including:
This type of segmentation helps deliver a truly personalized and more productive on-site experience, which is essential in achieving eCommerce conversion rate optimization.
Optimizing consumption is also about detecting points in your user journeys where user interaction is minimal, and finding ways to stimulate engagement, and—by extension—conversion. (And finding points where user interaction is high to capitalize upon them.)
Increasing user engagement can often be as simple as ensuring the elements users can interact with are accessible—and visible. Spotting these elements for yourself can be a little trickier—but DXA solutions can help.
When Lovehoney’s digital team wanted to assess the early performance of two Black Friday landing pages, they used Contentsquare’s Customer Journey Analysis tool to do it.
They found that less than 24% of users were getting from the landing page to a product description page—and 12.5% exiting the site directly.
Further investigation revealed that users who were filtering results were more likely to convert, but click rate on the sort and filter buttons was low. Lovehoney’s team responded by moving the three main categories out of the filter dropdown so users could click on these right away.
This resulted in more interaction (a measure of activity) on those filters, a 17% reduction in bounce rate and a staggering 30% increase in on-page conversions.
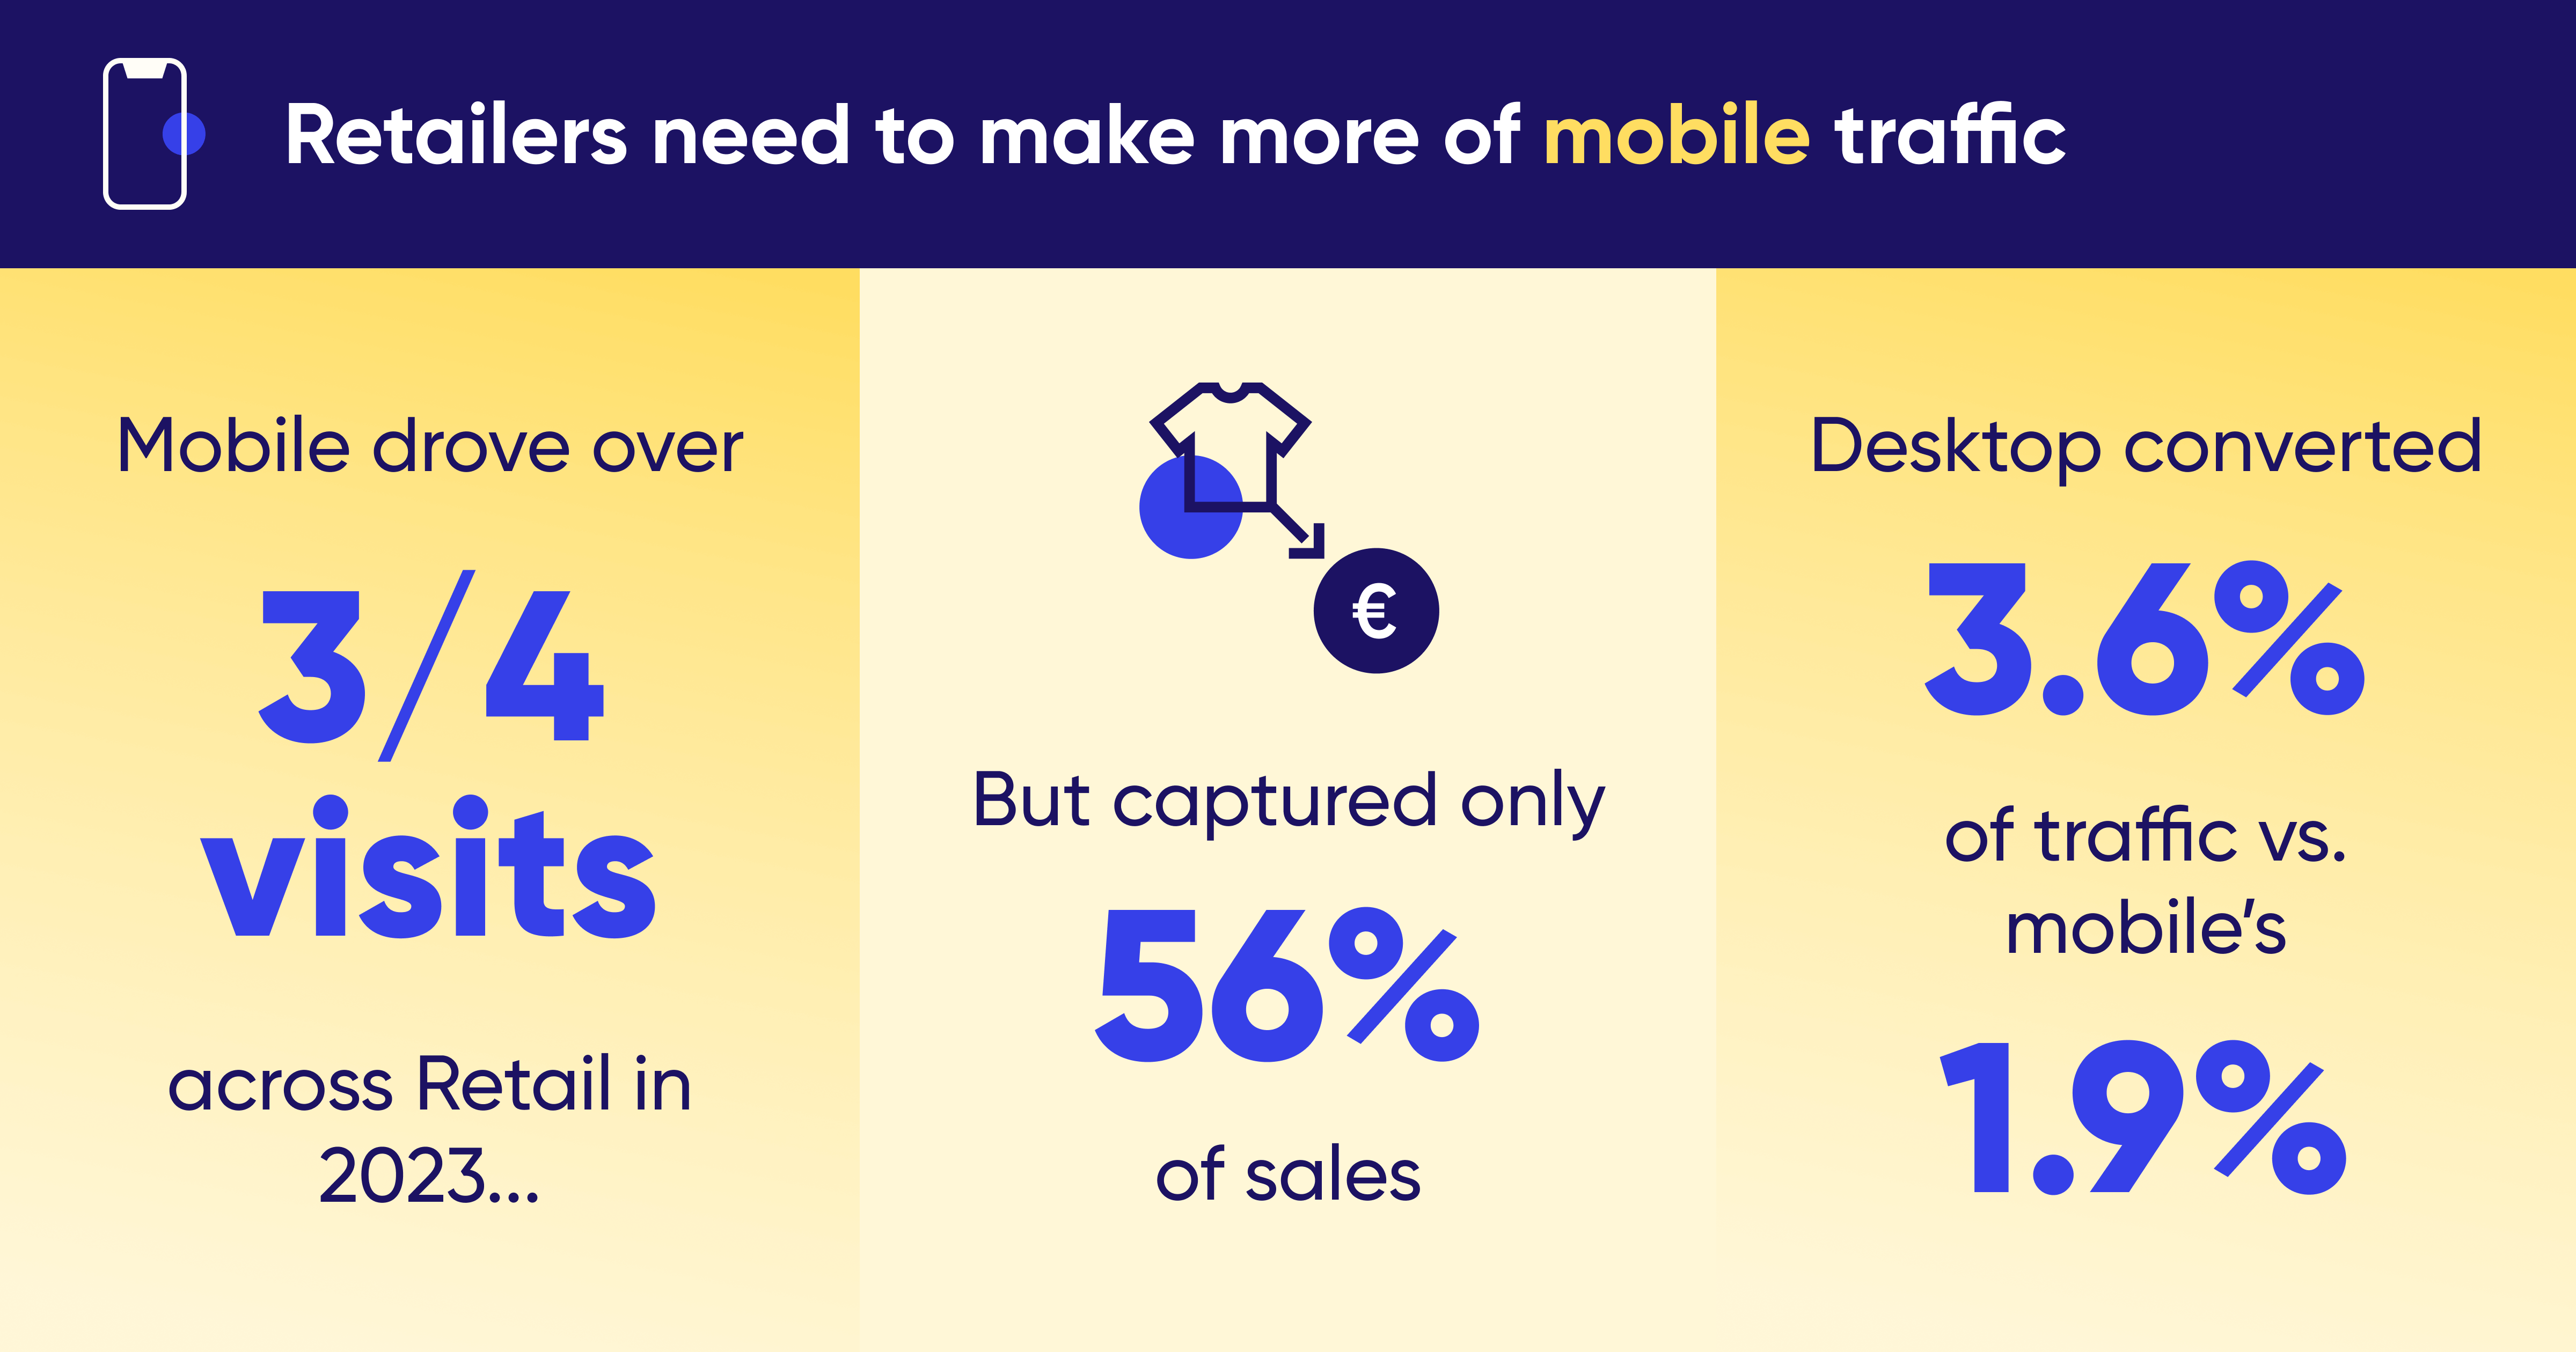
When it comes to traffic share, desktop is unquestionably losing out to mobile. Over 3 in 4 (77%) visits to retail websites last year took place on mobile. Conversion, however, is a different story.
Our Benchmark data shows us that in 2023, desktop achieved a significantly higher conversion rate (3.89%) than mobile (2.20%)—and, despite dominating traffic share, mobile captured only 56.3% of revenue for retailers.
See how your digital experience stacks up.
Get my free copy
Download the 2024 Retail Digital Experience Benchmark Report for the metrics that really matter.
The real insight here comes from analyzing the massive gap in time spent per session between desktop and mobile users:
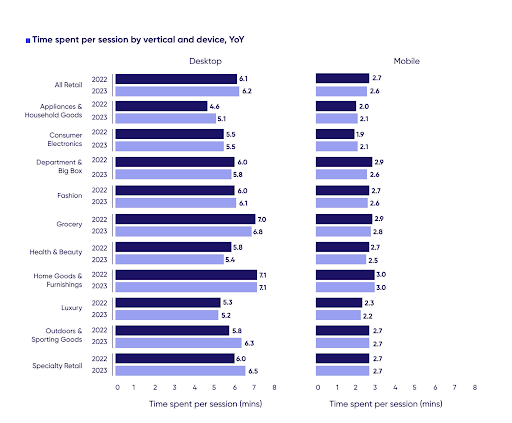
Shoppers on smartphones are grazing across a few pages quickly, spending far less time per page than desktop shoppers across every vertical. These ‘micro visits’ are less likely to end in conversions, since mobile users are easier to frustrate and harder to engage.
Retailers need to prioritize optimizing for mobile web traffic and, where appropriate, launching apps, which convert better than mobile web traffic.
Clearly, desktop still matters, particularly in high-consideration verticals (such as Appliances & Household Goods and Home Goods & Furnishings), where it continues to capture the majority of revenue. Retailers should, therefore, be wary of fixating entirely on mobile, and should seek to connect mobile and desktop experiences wherever possible.
That said, the increasing abundance of mobile traffic coming retailers’ way represents an as-yet largely untapped opportunity to drive more conversion. Retailers need to optimize their mobile experiences for conversion wherever possible—and again, DXA solutions can come in handy here.
In 2018, De Beers was set to launch a new website—and one of the digital team’s top priorities was to improve mobile conversion.
Zone-based Heatmaps showed them an unusual exposure rate on the product detail pages (PDPs) seen by mobile visitors. Despite an Add to Bag CTA sitting at the top of the PDPs, a large percentage were scrolling all the way to the bottom.
The team hypothesized that users were simply not seeing the button—it being easier to miss when scrolling on mobile. They decided to test to see what a sticky CTA on the PDPs would do to conversion rates.
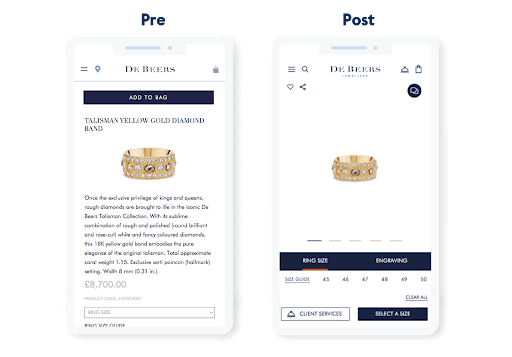
What it did was lift those conversion rates—by a remarkable 10%.
Hopefully, this article has given you plenty of ideas for making conversion-fuelling adjustments to your eCommerce experience.
Ultimately, however, while these strategic principles will help guide you in the right direction, you should be looking to test and experiment on your site as much as possible to find the strategies that work specifically for your business.
The behavioral data provided by a DXA solution like ours can take your testing and optimization efforts to the next level—and fashion retailer New Look can attest to this.
They used Contentsquare to monitor advanced behavioral metrics (such as click rate and conversion rate of specific elements on their site) when testing out placing user generated content on their product pages.
The results were spectacular, with New Look ultimately increasing their overall product conversion by an astounding 19%. Learn more in our New Look case study.
Check out our product demo today to get an idea of how Contentsquare could help you with eCommerce conversion rate optimization—and to convert more customers than ever before this year.
Take a product tour Get to grips with Contentsquare fundamentals with this 6 minute product tour.
 Take tour